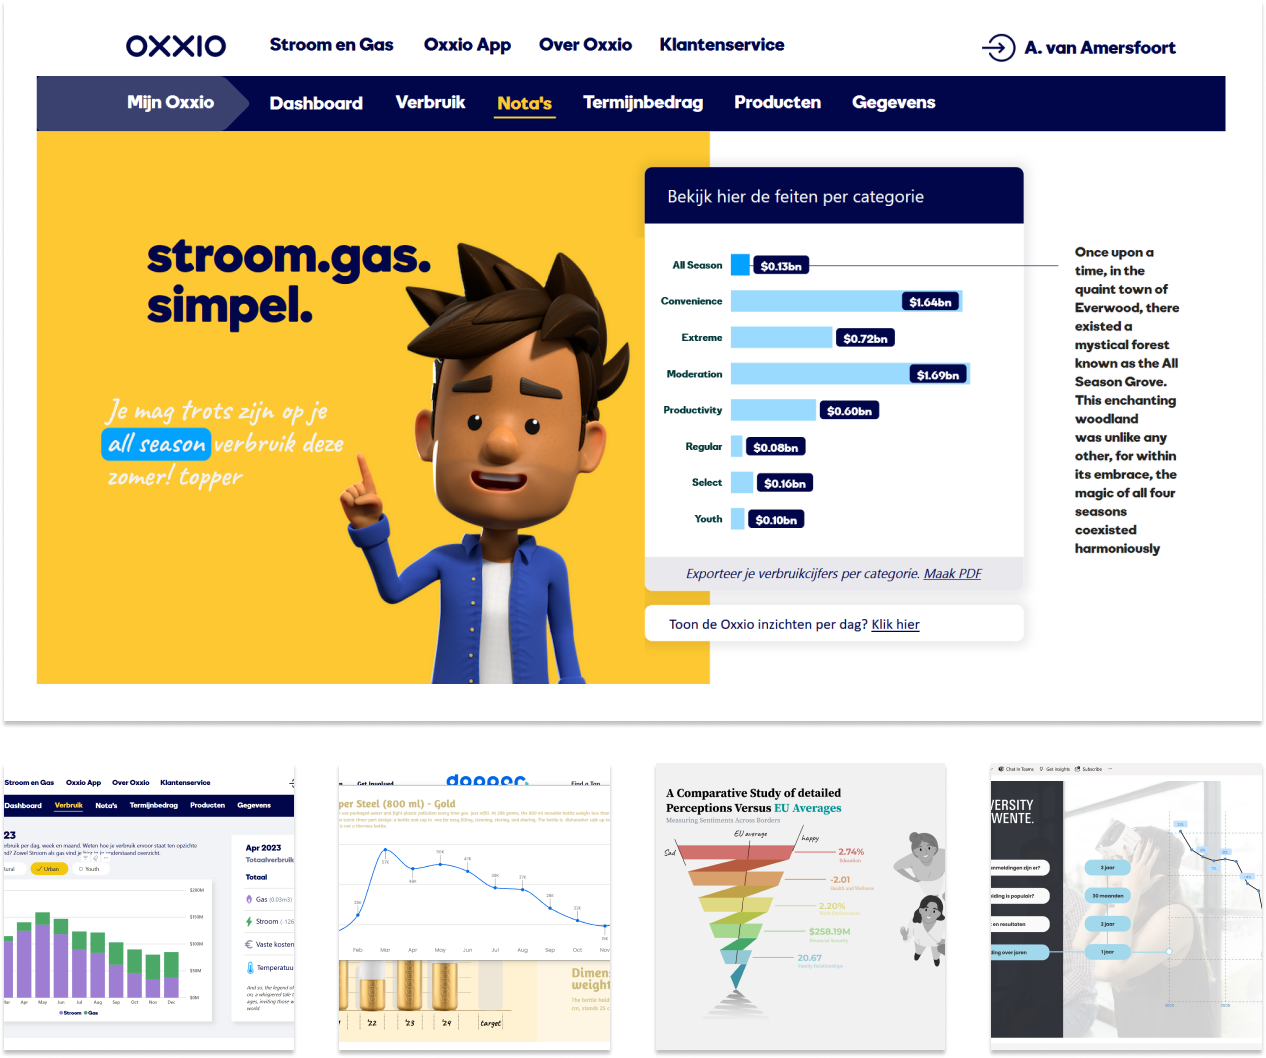




Storytelling in data visualization is the ability to tell a story with data, bringing abstract figures to life and giving them meaning. It goes beyond merely presenting facts; it’s about making the data narrate a story that resonates with the viewer and motivates them to take action.
Furthermore, storytelling in data visualization can be a powerful tool for advocacy and change. When data is presented in a way that tells a compelling story, it can highlight issues, influence opinions, and inspire action. By humanizing the numbers and showing their real-world impact, data visualization can become a catalyst for social, economic, and environmental change. In essence, it is not just about the data itself, but about how the data can be used to create a meaningful narrative that drives progress.